Pump Curve
A Pump Curve represents the relationship between the head and flow rate that a pump can deliver at its nominal speed setting.
- Head is the head gain imparted to the water by the pump and is plotted on the vertical (Y) axis of the curve in feet (meters). Flow rate is plotted on the horizontal (X) axis.
- A valid pump curve must have decreasing head with increasing flow.
-
EPANET will use a different shape of pump curve depending on the number of points supplied:
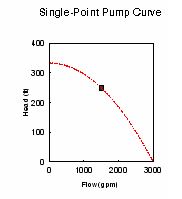
A single-point pump curve is defined by a single head-flow combination that represents a pump's desired operating point. EPANET fills in the rest of the curve by assuming: - a shutoff head at zero flow equal to 133% of the design head
- a maximum flow at zero head equal to twice the design flow.
A three-point pump curve is defined by three operating points
:- Low Flow (flow and head at low or zero flow condition)
- Design Flow (flow and head at desired operating point)
- Maximum Flow (flow and head at maximum flow).
EPANET fits a continuous function through the three points to define the entire pump curve.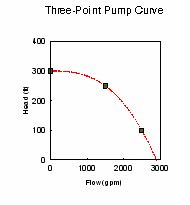
A multi-point pump curve is defined by providing either a pair of head-flow points or four or more such points. EPANET creates a complete curve by connecting the points with straight line segments. 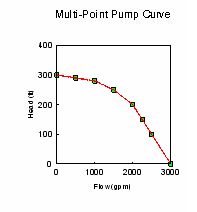
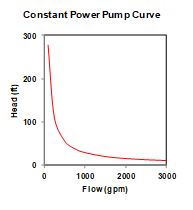
A constant power pump is a pump that operates at a constant horsepower or kilowatt rating over all combinations of flow and head. The user only needs to supply the pump's power rating.