|
Parameter
|
Description
|
|
Max. Infil. Rate
|
Maximum infiltration rate on the Horton curve (in/hr or mm/hr) (see table below)
|
|
Min. Infil. Rate
|
Minimum infiltration rate on the Horton curve (in/hr or mm/hr). Equivalent to the saturated
hydraulic conductivity. See the Soil Characteristics Table
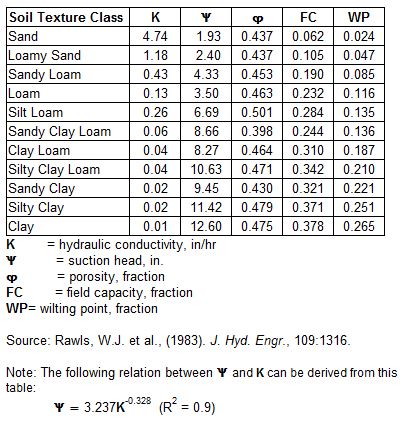 for typical values.
|
|
Decay Const.
|
Infiltration rate decay constant for the Horton curve (1/hours). Typical values range
between 2 and 7.
|
|
Drying Time
|
Time in days for a fully saturated soil to dry completely. Typical values range from 2 to 14 days.
|
|
Max. Infil. Vol.
|
Maximum infiltration volume possible (inches or mm, 0 if not applicable). Can be estimated as the difference between a soil's porosity and its wilting point times the depth of the infiltration zone.
|
|
Representative Values for Max. Infiltration Rate
-
DRY soils (with little or no vegetation):
Sandy soils: 5 in/hr
Loam soils: 3 in/hr
Clay soils: 1 in/hr
-
DRY soils (with dense vegetation):
Multiply values given in A. by 2
-
MOIST soils
Soils which have drained but not dried out (i.e., field capacity):
divide values from A and B by 3.
Soils close to saturation:
choose value close to min. infiltration rate.
Soils which have partially dried out:
divide values from A and B by 1.5 - 2.5.
|
|
Parameter
|
Description
|
|
Suction Head
|
Average value of soil capillary suction along the wetting front (inches or mm)
|
|
Conductivity
|
Soil saturated hydraulic conductivity (in/hr or mm/hr)
|
|
Initial Deficit
|
Fraction of soil volume that is initially dry (i.e., difference between
soil porosity and initial moisture content)
|
|
The initial deficit for a completely drained soil is the difference between the soil's porosity
nd its field capacity. Typical values for all of these parameters can be found in the
Soil Characteristics Table.
|
|
Parameter
|
Description
|
|
Curve Number
|
This is the SCS curve number which is tabulated in the publication SCS Urban Hydrology
for Small Watersheds, 2nd Ed., (TR-55), June 1986. Consult the
Curve Number Table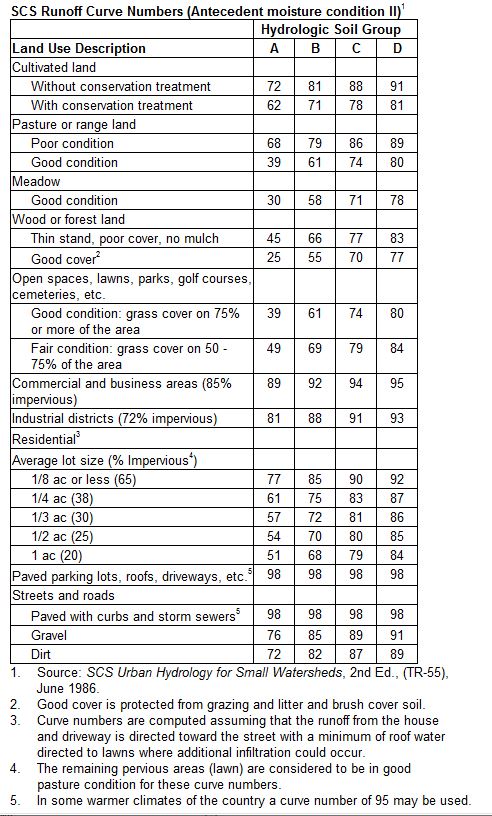 for a listing of values by soil group, and the accompaning
Soil Group Table
for a listing of values by soil group, and the accompaning
Soil Group Table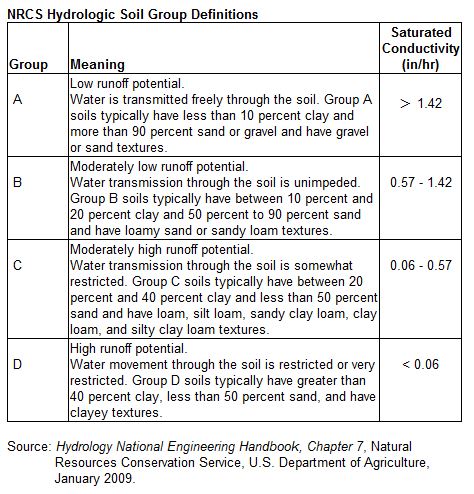 for the definitions of the various groups. Adjustments will be needed when a subcatchment contains separate pervious and impervious fractions and a Curve Number is selected from a table where the two land uses are lumped together.
|
|
Conductivity
|
This property has been deprecated and is no longer used.
|
|
Drying Time
|
The number of days it takes a fully saturated soil to dry. Typical values range between 2 and 14 days.
|
|
Parameter
|
Description
|
|
Infil. Pattern
|
Name of optional monthly Time Pattern adjustments applied to the pervious area's hydraulic conductivity. Leave blank if not applicable.
|