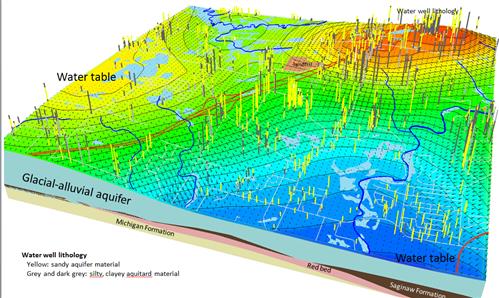
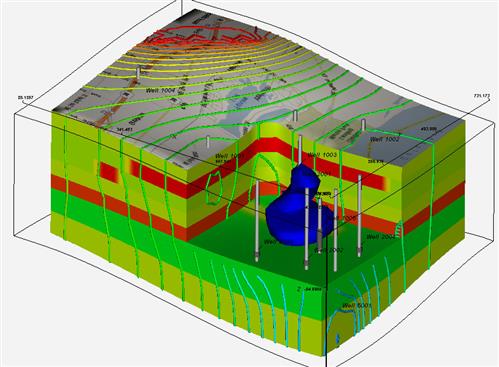
Mapping of aquifer extents (side elevations), groundwater head distribution, water well lithologies (vertical lines), surface water network (light blue lakes and dark blue streams/rivers), and important human infrastructure (highway and landfill location)
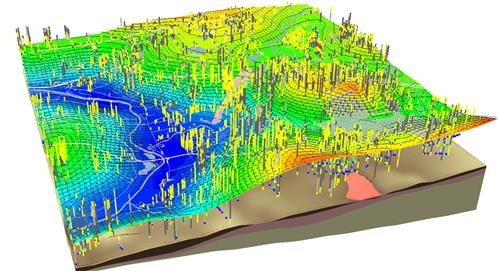
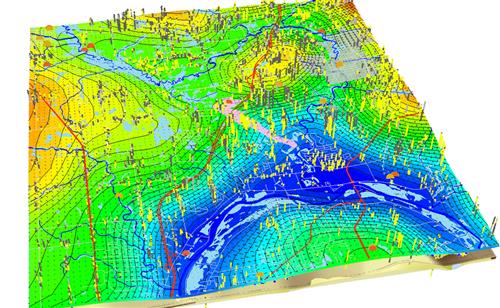
Groundwater head distribution, water well lithologies and water chemistry (vertical, colored lines), and surface water network (blue features).

3D view into the subsurface, with a characterization of water well lithologies and water chemistry (vertical, colored lines), and the underlying geologic units.
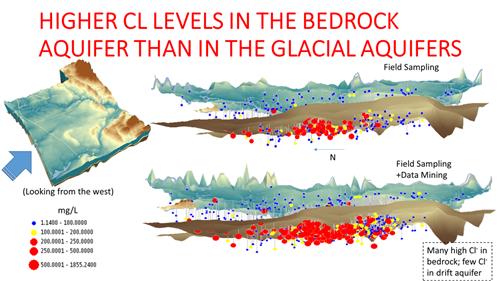
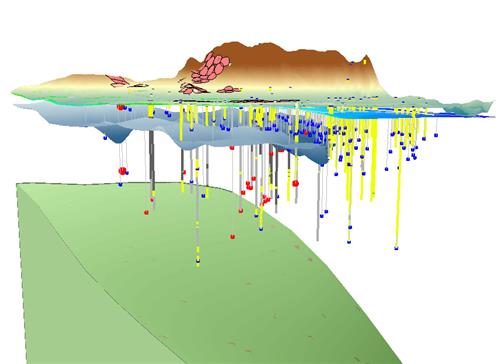
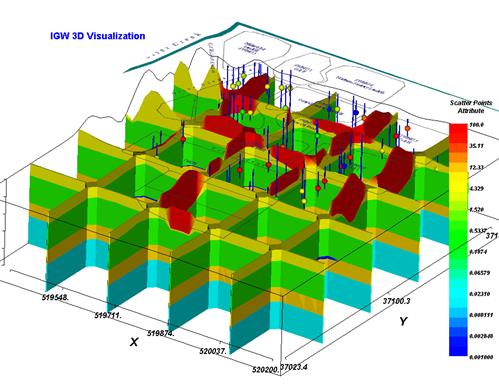
3D visualization of point measurements of dissolved chloride (Cl) collected from field sampling and historical data mining.
3D interpolation of dissolved chloride (Cl) concentrations in a county-wide aquifer system. Blue indicates low levels (<100 mg/L); red indicates high concentrations (>500 mg/L).
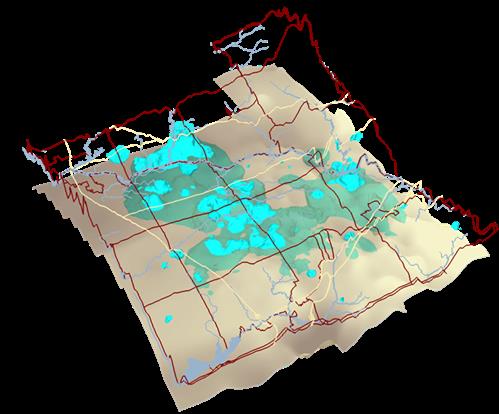
3D iso-surfaces of dissolved chloride concentrations of Cl=250 mg/L, in the unconsolidated sediments (light teal) and bedrock aquifer below (dark teal).
3D visualization of water quality below a landfill site.
Near-surface water quality near a wastewater spray irrigation field.

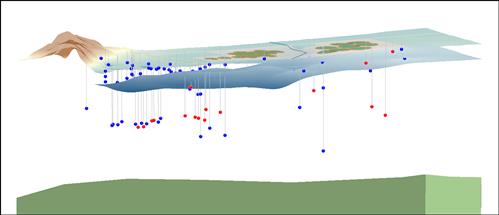
3D visualization of water quality at a contamination site.
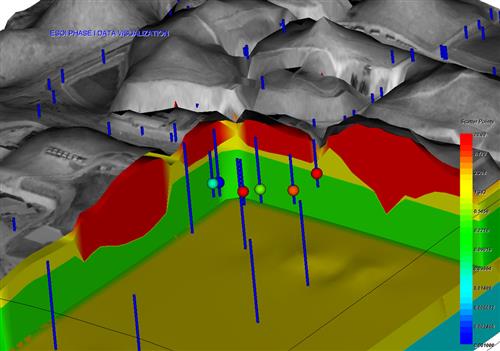
3D visualization of aquifer extents and groundwater quality measurements at a landfill contamination site.
Close up of geology and groundwater water quality at a landfill contamination site.
Groundwater head contours and a 3D iso-surface of water quality at contamination site.