St Johent Problem
(Beginner to Advanced – Multi-step Problem, which can be done sequentially or individually; conceptual; analytical; local and regional flow modeling; plume transport; scenario testing)
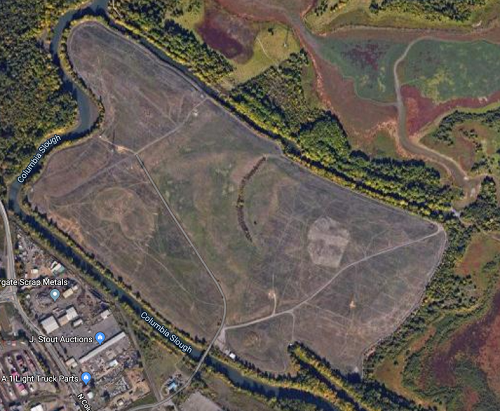
The figure above the St Johns landfill, a 225-acre landfill located in North Portland, Oregon, near the confluence of the Columbia and Willamette Rivers. The landfill sits on a thick layer of silt (average thickness ~50ft), which in turn overlies a fairly transmissive gravel aquifer. The aquifer covers the entire area between the Columbia and Willamette rivers and extends east past North Portland Road. It is known the aquifer is well connected (hydraulically) with the two rivers.
Field data suggest that water level in the landfill is well above the water level in the surrounding surface water bodies due to infiltration of precipitation. This provides a driving force for leachate loading into the surface waters as well as the deep aquifer below the landfill. Metro recently capped the landfill to prevent further infiltration of precipitation (see below).
You are asked to evaluate to evaluate the effectiveness of landfill capping by developing an analysis which describes the dissipation of the leachate mound inside the landfill.
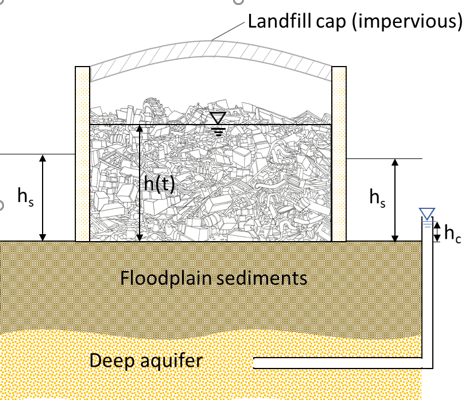
Conceptual cross-section of the regional hydrogeology of the site.
Problem 1:
Describe the water balance in the landfill (inputs and outputs) when the water level in the landfill is rising, prior to capping. Then describe the water balance in the landfill when the water level is falling, after capping the landfill.
Consider using sketches to supplement your descriptions.
Problem 2:
For the parameters listed below, find the steady state mean water level inside the landfill for both pre-capping and post-capping conditions. Also determine the hydraulic response time, or how long it will take for the mean water level to approach within approximately 40% of that of steady state.
- Conductivity of the floodplain sediments Kfp = 0.01 ft/d
- Average thickness of the floodplain sediments bfp = 50 ft
- Transmissivity of the perimeter dike wallTd ≈ Kdhs
- Perimeter dike thickness bd = 3 ft
- Specific Yield = 0.05
- Water level in the landfill immediately following capping h0 = 50 ft
- Long-term mean water level in the surrounding surface water bodies hs = 10.5 ft
- Long-term mean head in the confined aquifer hc = 9 ft
- Perimeter length L = 20,000 ft
- Landfill Area = 5000 ft2
Problem 3:
Using the parameters provided in Problem 2, develop a two-dimensional groundwater model for the St. Johns Landfill and apply the model to compute the vertical seepage flux to the deep aquifer and lateral flux to the slough for post-capping conditions.
Problem 4:
Now we will consider the movement of leachate off-site for pre-capped and post-capped conditions.
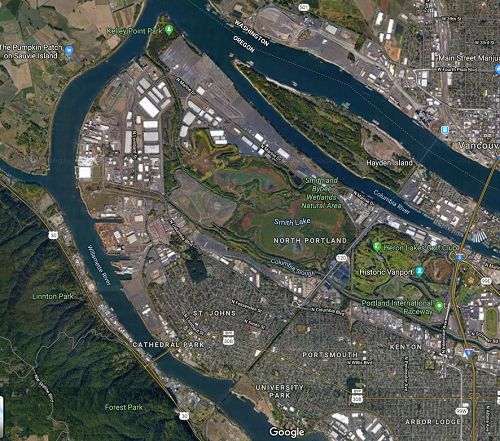
Since the plume has entered the gravel aquifer, data show it moving north with the regional flow (see below). Based on borehole data, it is known the top of the gravel aquifer comes within 5 to 10 feet of the bottom of Bybee Lake. The silt layer is very thin here and concern has risen that the contamination entering the aquifer may discharge into the lake.

Movement of leachate off-site.
It is proposed that a water level control on Bybee lake be removed, the net result being the average lake level would rise 1 ft. and help reduce discharge into the lake. There is also a proposed pumping well for the Port of Portland installed north of Bybee Lake.
Your job is to model the regional flow and test the remediation scenarios. If those scenarios are inadequate, come up with a remediation plan that will prevent the spread of contamination off the landfill site.
Constructing a regional model
Construct a regional model of the site and surrounding water bodies using the following parameters determined from a previous study:
|
Average long-term recharge (in/yr)
|
10.0
|
|
Effective porosity
|
0.25
|
|
Longitudinal dispersivity
|
5 ft
|
|
Transverse dispersivity
|
0.5 ft
|
|
Landfill leachate mound infiltration rate
|
25 ft above the land surface
|
|
Conductivity of the floodplain deposits
|
0.1 m/d
|
|
Thickness of floodplain deposits
|
15 m
|
|
Conductivity of the gravel aquifer
|
50 m/d
|
|
Thickness of the gravel aquifer
|
120 ft
|
|
Conductance (leakance) of rivers
|
1 d-1
|
|
Conductance of lakes
|
1 d-1
|
Model Predictions
Compare the 20-year effects of:
- Doing nothing.
- Capping the landfill and reducing the leachate mound to the ground elevation.To do this, model the landfill as changing over time, dropping 5 ft per year until it reaches a mound of 0 ft. elevation.Assume that once the landfill mound height drops to zero, the source is no longer continuous.
- Opening up the lakes to the sloughs.Adjust the lake elevations to increase 1 ft from the base level derived from the DEM (Digital Elevation model).
- Doing both 2 & 3.
For your comparison, do a mass balance on Bybee lake as well as a visual comparison of plume movement. The idea is to keep the plume located as close to the landfill as possible.
Now design a pump and treat system, coupled with the ‘best’ of the 1-4 scenarios above that will contain the contaminant plume and minimize the damage.
Document your results
Report your results in a professionally prepared memo/short report, outlining all your assumptions and methods. Include your visualizations of plume movement and water balances under various scenarios.