There are several factors that can affect movement of a contaminant. This includes mechanical dispersion and molecular diffusion, reactive decay of the chemical and sorption interactions with soils and sediments (partitioning). But one thing that is always important (and is often the dominant factor) is the movement of the contaminant due to the flow of groundwater – or advective transport. We learned early in Section 4 how to use particle tracking to visualize groundwater pathlines, which are the trajectories that individual fluid particles follow in a steady-state flow field So, if you want to see where a contaminant has gone over a period of time, particle tracking is a useful tool.
In Section 4.2.3, we learned how to access the Particle Tracking placement tools by going to Simulation Tools and clicking the ParticleTK button. Now, we will select the ParticleRect option so that we can place a particle rectangle at the location of a suspected source of contamination. Add a ‘particle rectangle’ over the Vermont Car Care business (as a hypothetical source of groundwater contamination) in the same manner you would add a rectangular zone: use a single-click to indicate the position of one corner of the rectangle, and, after a pause, another to indicate the position of the corner that is diagonal from the first placed corner (see Figure 62).
Click SIMULATE after the rectangle is added to re-submit the model for solving. The usual prompts regarding resetting the model and the model projection system will appear; but you will also see a prompt related to performing forward or backward tracking of the particles along the steady flow field (see Figure 63). We wish to do forward tracking, i.e. determine where contaminants at the specified particle locations will go, so click OK.
When the new model results appear, particle pathlines will begin emanating from the “contamination site” and will flow along the simulated flow field based on computed velocity vectors, over time tracing out the “envelope” of the potential area of impact downgradient from the site (see Figure 64).
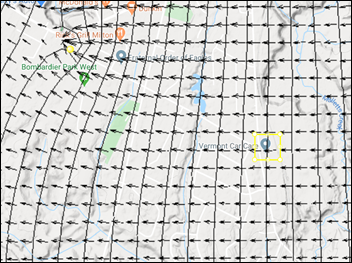
Figure 62: A rectangular particle zone added to the submodel.
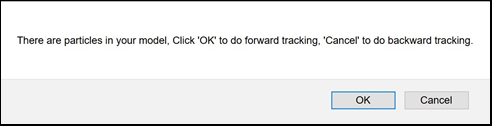
Figure 63: Prompt regarding whether to perform forward particle tracking or backward particle tracking (click OK to choose forward).
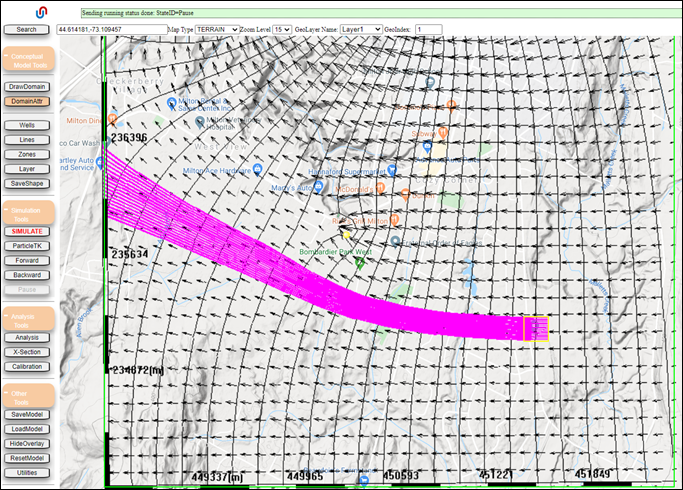
Figure 64: Forward tracking of particles using the simulated velocity field (pumping well ON).