MAGNET has many options for visualizing computed results, especially the plan view results shown in the map display. We have seen earlier the contouring option with superposed velocity vectors. In this section we will explore a few other possibilities. To access the control panel for selecting visualization options you go to the Domain Attributes menu (DomainAtt button) and then select Display Settings. The control panel will appear as shown in Figure 89.
The primary change you might make here is to the Data Limits of the Head Draw Options. The Max will be the highest observable contour and Min will be the smallest. Changes to the Velocity Draw Options could also be of interest. Clicking the box next to Head Legend will add a head legend when you click the SAVE button.
Next click on the Contour and Vectors button (the little v to the right of this window). Select the particular option that best fits your needs. When finished click on the SAVE button. The message presented in Figure 90 appears. Click OK to continue.
Next we add color to the plot and get Figure 91 . One aspect of this choice is that we lose the geographical map features. But we can return to the Display Settings menu and change the Overlay Transparency (top-right portion of the menu) to a value larger than 0 (up to 100 percent transparency). Or we can temporarily hide the output overlay by clicking Other Tools, then HideOverlay. To toggle back to having the model output shown, click the ShowOverlay button that now occupies the space the HideOverlay button once did (and so on and so forth).
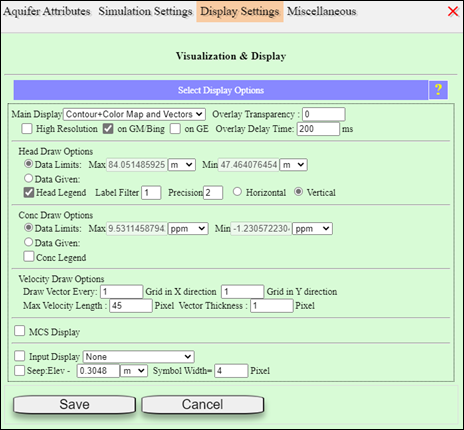
Figure 89: Updated plan view display to show head in color map and to add a head legend.
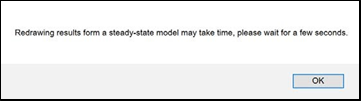
Figure 90: Warning message regarding the calculations required to prepare your plot.
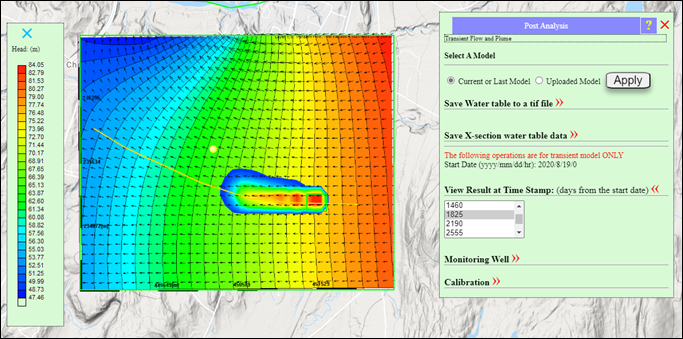
Figure 91: Updated plan view results with a head color legend.