1Navigate to DataNET and log in
DataNET is the geospatial data hub at the heart of the MAGNET4WATER ecosystem. It's browser-based — nothing to install — and routes you to authoritative water data sources worldwide.
- Go to magnet4water.net.
- From the header: (Quick Access menu).
- Enter your MAGNET account credentials. (If you don't have one yet, free sign-up takes about two minutes.)
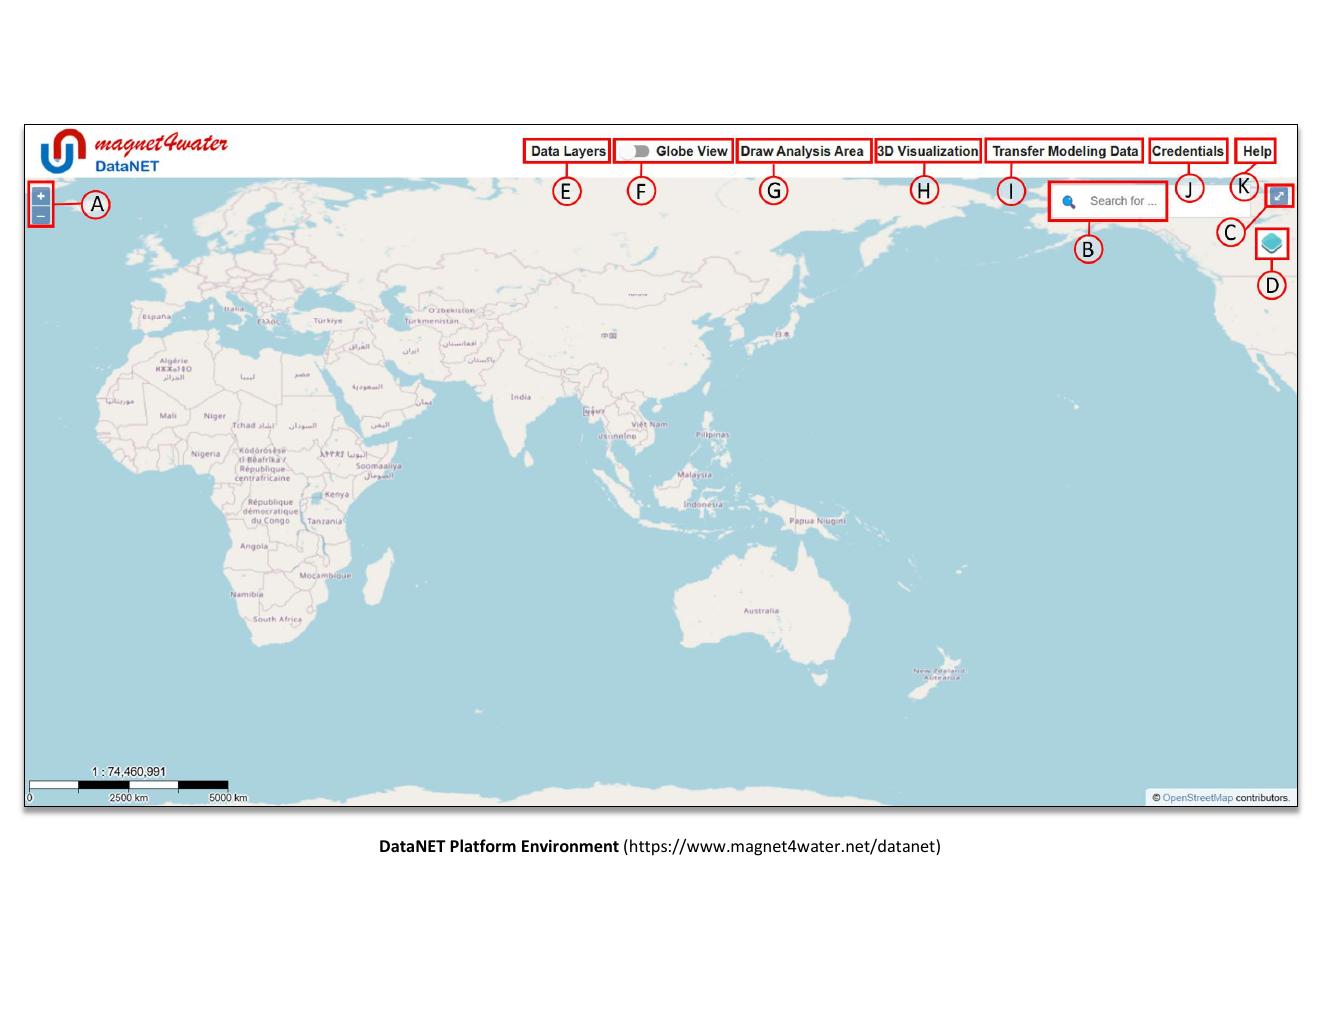
After login, the DataNET home screen loads — a global Map Display occupies most of the view, with a Title Bar of tools and submenus at the top. Everything else in this tutorial is about what you see there.
2Map & view tools (A–D)
The four basic controls that frame every other interaction with DataNET.
AZoom in / Zoom out
The classic + / − buttons. You can also zoom with the mouse wheel or pinch gesture on touch devices.
BSearch Bar
Find addresses, cities, landmarks, or coordinates using the built-in OSM geocoder. Type a query, select a result, and the map recenters.
CFull-screen toggle
Expands the map to fill the whole browser viewport. Useful when you want to see wide spatial patterns without UI clutter. Press Esc or click the toggle again to return.
DBackground Map
Several base maps are available as background imagery for the Map Display. Click to switch between:
- OSM (default) — OpenStreetMap standard view
- ArcMap — ArcGIS vector basemap
- ArcMap Imagery — ArcGIS satellite imagery
- USGS Topo — U.S. Geological Survey land-surface topography
- USGS Imagery — USGS satellite imagery with street overlay
- USGS Imagery Only — USGS satellite imagery, no labels
- Water Color — Stadia Maps stylistic basemap
- Blank Map — plain white — useful for publication-ready exports
Globe View mode has its own separate basemap options (see §4).
3Data Layers menu (E)
The gateway to DataNET's core asset — the federated catalog of thousands of water-related data layers from global, national, state, and local sources. From this menu you can:
- Open the Data Layer Library to search and browse the full catalog
- Open your personal Workspace (a saved collection of your frequently-used layers)
- (Admin only) Add or edit web data services from known URLs
The library is intelligently organized so you can find what you need in several complementary ways:
- Geographic region — global, continental, national, state/provincial, county/district, or by major river basin
- Environmental category — climate, soil, groundwater, land use, surface water, etc.
- Keyword — free-text search across layer names and metadata
- Format — WMS (map images), WFS (vector features), WCS (raster grids)
Full mechanics of library searching are covered in Tutorial 1 — Data Library & Workspace.
4Globe View toggle (F)
Toggle between the traditional plan-view map display and a fully 3D geospatial view powered by Cesium. Globe View drapes WMS layers onto a digital terrain model in real time, and is where vector (WFS) and raster (WCS) 3D visualizations come alive.
Covered in depth in Tutorial 11 (Visualizing Maps) and Tutorial 7 (Globe View WFS Styling).
5Draw Analysis Area (G)
Some tools in DataNET — notably 3D Visualization and Transfer Modeling Data — need to know which part of the world you're working on. The Draw Analysis Area menu lets you define that area using either:
- Rectangle — drag-to-draw a bounding box
- Polygon — click-by-click an irregular boundary
The analysis area acts as the spatial filter and clipping boundary for subsequent operations. Once drawn, it persists until you change it.
63D Visualization (H)
The 3D Visualization menu is context-sensitive:
- In plan view — it gives access to the VTK3D tools, which build Cartesian-coordinate-based 3D models of data-layer surfaces and textures (elevation surfaces, subsurface volumes, cross-sections, etc.).
- In Globe View — it gives access to Cesium 3D rendering tools to render DataNET WFS/WCS layers as 3D objects in the Cesium framework (lithologies as cylinders, buildings as extrusions, custom-styled vectors in 3D space).
See Tutorial 4 (Prepare 3D Data), Tutorial 5 (Render 3D), Tutorial 6 (VTK 3D), and Tutorial 13 (Borehole Lithologies) for the full range.
7Transfer Modeling Data (I)
The bridge to the rest of the MAGNET4WATER ecosystem. From this menu you can get DataNET layers (WMS map images, WFS vectors, or WCS rasters) — or even take a screen capture of the current map — and send the result to any of the MAGNET4WATER modeling platforms:
- IGW-NET — groundwater (MODFLOW)
- SwaNET — watersheds (SWAT)
- StormNET — stormwater (SWMM)
- ConduitNET — water distribution (EPANET)
End-to-end transfer workflows are covered in Tutorial 2 and Tutorial 3, with a complete groundwater-modeling example in Tutorial 9.
8Credentials (J) & Help (K)
JCredentials
Sign in or out, view or edit account information, change password. Some DataNET features — including data transfer to modeling platforms — require an authenticated session.
KHelp
General descriptions of the DataNET environment, a "Contact Us" form for reaching the development team, and quick links to the documentation library you're reading right now.