The simulated head and velocity distributions can be used to visualize groundwater pathlines. A pathline is the trajectory that individual fluid particles follow in a steady-state flow field. We will next calculate pathlines for mathematical particles that we will locate in our model. MAGNET will allow you to introduce these particles in a number of ways, e.g. placing them as individual points, within a polygon or around a pumping well.
Given our existing flow model, the first step in computing and plotting path lines is to click on Simulation Tools and then ParticleTK (see Figure 21). You can add particles along a drawn line, or inside of a rectangle or polygon added to the map display. We will add a particle line along a head contour near the center of the model where flow is diverging and observe the movement of each particle as representative of the groundwater particle flow path or pathline.
Click the ‘ParticleLine’ option. A large “plus sign” (+) will appear on your model and you can trace the line segment along which to place your particles. The trace or line segment will be made up of connected dots whose positions can be edited with click-drags. Each new click in the map display will produce a dot. The end result appears in Figure 22 as a piecewise continuous yellow line along the contour near the center of the figure that is trending north-northeast from location (480,000, 214,000).
Then re-submit the model for simulation, accept the projection system, and click on OK and you be asked whether you want forward or backward tracking (Figure 23). Backward tracking traces a path from where the particles you have defined came from in the past. Forward tracking in contrast defines where they will go in the future. We wish to do forward tracking, so click OK.
As the model calculates the time evolution of the particles, the window that contains the figure is continually updated so it is possible to observe the changes over time of the groundwater hydraulic head and the movement of the particles. The results after many simulation years are shown Figure 24. Note that some of the pathlines are longer than others. These longer pathlines represent longer distances traveled by some particles compared to others over the simulation period. The longer pathlines are found in areas where contours are closely spaced together, indicating larger head gradients and larger resulting groundwater flow velocities.
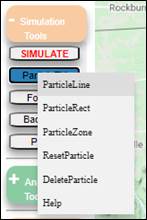
Figure 21: Accessing the Particle placement tools.
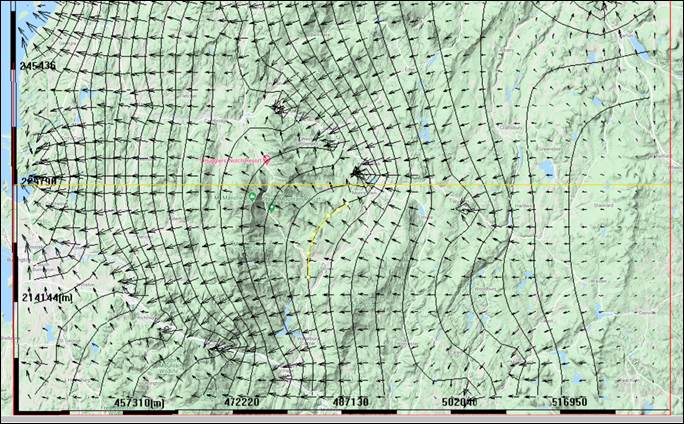
Figure 22: Particle line added to the model.
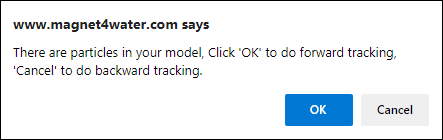
Figure 23: Prompt to determine whether forward or backward particle tracking will be used.
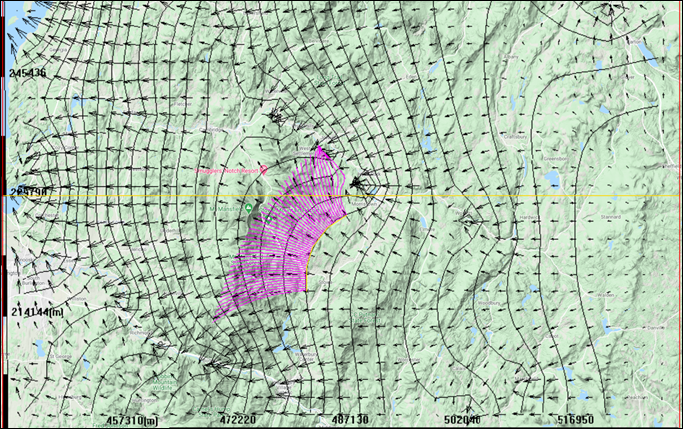
Figure 24: Simulated groundwater pathlines.