Let us now further extend our modeling capabilities to accommodate a stream or river. The major conceptual change is that we will now consider the surface water body to be a line rather than an area.
To begin the process click Conceptual Model Tools, then Lines, then DrawLine as shown in Figure 46. Once you click DrawLine the large plus sign will appear on your model and you can trace the course of your river (in this case, we will trace the upstream portion of the Lamoille River). The trace of the river will be made up of connected dots as was the case with the lake boundary. Each click will produce a dot. The end result appears as in Figure 47. Now click on SaveShape. The Line Attributes window will open as seen in Figure 48. You have some choices here as to how you describe the hydrodynamics of the river aquifer system. The simplest is to use the Prescribed Head option with a constant head value. To do this you click the radio button for Constant and replace the zero value with the river water level elevation (head) that you wish to assign. A variant on this is to allow for a variable river stage along the rivers course. To do this you click the radio button in front of Variable and then click ‘>>more’. This launches the menu shown in Figure 49. Here you can specify the river stage as the land surface elevation less a specified value. This allows for the provision of a river reach that has a sloping surface, which is the realistic option.
The prescribed flux allows for the specification of leakage into and out of the stream directly. The head dependent flux option is similar to the treatment applied to the lake (see previous subsection), and it is the treatment we will use now. Choose the radio button next to Two way and then click the >>more button to open the Edit Polyline Attributes submenu (Figure 50). Again, you can specify the stage as the land surface elevation less a specified value. Use all defaults options and click ‘OK’ to close the menu (click the ? button to get complete details of this submenu). At the end of the input process click SAVE.
You may decide to modify the attributes of your river or to draw another segment. The procedure for the case of changing river properties is presented in Figure 51. You begin by clicking on Conceptual Model Tools, then on Lines, then on LineAttr. At this point you see the window presented as Figure 73. Note that the option of Line Attr is no longer available, but has changed to AcceptEdit.
Let us repeat the process for the downstream segment Lamoille River. We begin by tracing the river section using the DrawLine tool and treating it as a two-way head dependent boundary condition as described above. The resulting line feature is shown in Figure 53.
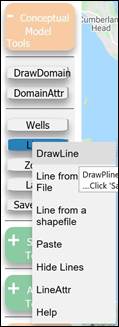
Figure 46: The sequence of click to initiate drawing the trace of the river on your model. The process is to click Conceptual Model Tools, then Lines, then DrawLine.
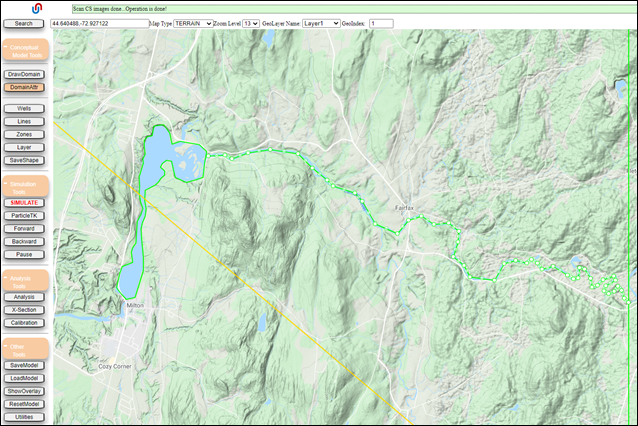
Figure 47: Trace of river constructed through clicking the mouse at each dot location.
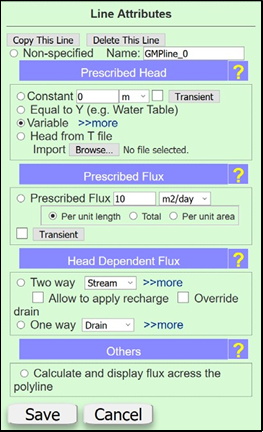
Figure 48: Trace of river constructed through clicking the mouse at each dot location.
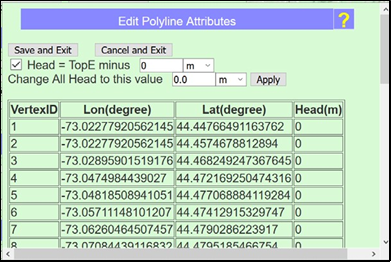
Figure 49: Input window for allowing for a variable stage along the length of a river.
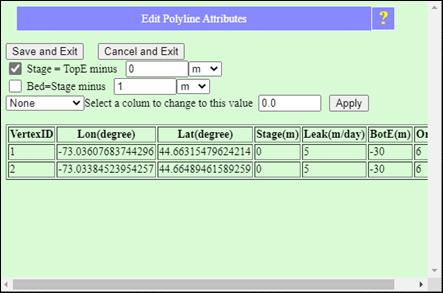
Figure 50: Edit Polyline Attributes menu for two-way head dependent flux treatment of a line feature.
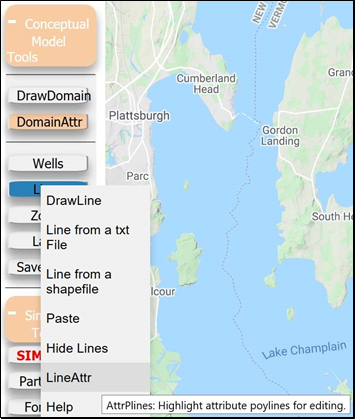
Figure 51: Sequence of steps to make a modification of the river attributes.
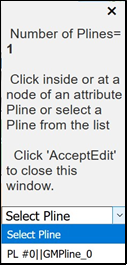
Figure 52: Panel provided for selection of line of interest in the event there are multiple lines.


We are now ready to simulate our system and we go to Simulation Tools and then SIMULATE. Then we are greeted with the “projection system message”. Upon clicking OK we obtain the solution provided as Figure 54.
Again, show the results in “chart view” by navigating to Analysis Tools, Analysis, then Display Charts. Figure 54 shows the flow field we have obtained using all the various conditions described to this point. This now includes the river. Also note that new ‘Stream’ terms were added to the aquifer water balance. Apparently, under this model representation and grid resolution, the Lamoille River is serving primarily as a source of water to the aquifer, although in some areas groundwater is clearly flowing into to the river as indicated by the water table contours.
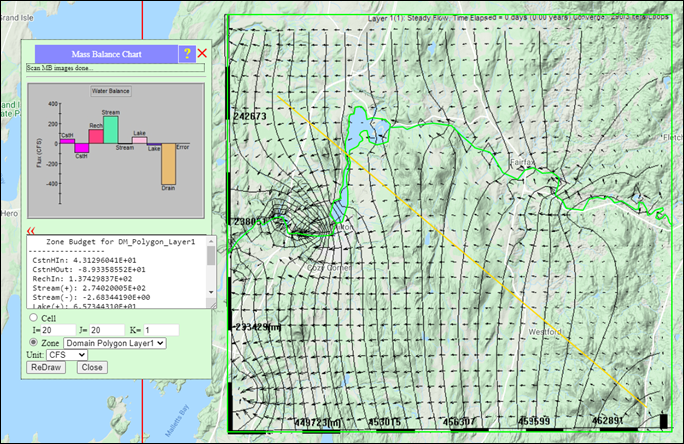
Figure 54: Submodel results including the lake and stream features added to the model.